Dawid Nawrocki

alt_name
Map archive
Click here to view maps of UK general election polling refactored using multi-member constituencies under D'Hondt apportionment, updating monthly.

A proposal for electoral reform in UK general elections

29. September 2025

Contents

1. Introduction: a criticism of FPTP
2. An alternative system
3. Methodology
4. Critical analysis of results
5. What about independents?
6. Conclusion: what this could mean for British voting practices

Introduction: a criticism of FPTP

First-past-the-post — the electoral system that the UK uses for its parliamentary elections — is notorious for being very disproportional in its allocation of seats compared to popular vote. In 2019, Boris Johnson's Conservatives won a landslide mandate to "Get Brexit Done" winning 365 out of 650 seats in Parliament — 40 seats above the threshold for a majority. However, they did not receive the majority of the vote from the British populace. While receiving 43.6% of the popular vote is incredible for one party in UK politics (the highest percentage in 40 years, in fact), it remains that the majority of Britain's electorate did not choose the Conservatives and thus they should not have received a majority of seats in Parliament.

While the 2019 result was certainly bad in terms of proportionality, things only got worse in 2024. According to Wikipedia, the 2024 general election was the least proportional election in history, with Keir Starmer's Labour winning 411 out of 650 seats with only 33.7% of the popular vote. That's nearly two-thirds of the seats being represented by one-third of voters. On the flip side, smaller parties receive far fewer seats than their vote count suggests they should. 14.3% of people in 2024 voted for Nigel Farage's Reform UK, which ideally should give the party 93 seats. In reality, Reform got 5. The story is the same for the Green Party: 6.4% of the votes receiving a mere 4 seats, or 0.6% of Parliament.

The current system inevitably leads British politics into a two-party system, and punishes people who support smaller parties, since general elections are really just hundreds of small, local elections, each with exactly one winner — the local MP. So if you're, say, a supporter of the Greens and you don't happen to live in exceptionally Green-voting places like Brighton or Bristol, you're out of luck because your local Green candidate likely has no chance of winning. Same goes for Lib Dems in most places outside of the West Country and the South East, or for Reform in much of Scotland. Therefore, you're more likely to tactically vote against one of the two parties that actually does have a chance of winning your constituency (the "lesser of two evils" so to speak), rather than for the candidate of the party you like the most. This matters because the UK's voting tendencies resemble those of many European democracies much more rather than a true two-party system like the United States. Our major parties do not get sweeping majorities, tending to get 30-40% of the vote, with our third, fourth, and fifth parties usually at around 5-15%. And yet representation in Parliament still does not reflect this (see diagrams below).
2024 UK election popular vote
2024 UK election seats
September 2025 UK popular vote poll per Electoral Calculus [link]
September 2025 UK seat prediction per Electoral Calculus [link]
2025 German election popular vote
2025 German election seats

An alternative system

An alternative system I'm proposing the UK could use instead is one I'm going to call "proportional representation with multi-member constituencies using the D'Hondt method of apportionment" — a very wordy title but it's the system that countries like Finland and Poland use. The way it works is as follows:
1) Instead of each constituency having just one winner who got the most votes, each constituency sends multiple MPs to Parliament, proportional to how the electorate in that constituency voted, allocated using the D'Hondt method (explained in detail later).
2) Inside each constituency, there is a party list — for each party there is a list of local candidates from that party on the ballot. In an open-list system (like in Finland or Poland), the voter selects exactly one candidate from one party (or one independent). In a closed-list system, the voter simply selects one party (or one independent), and the party decides the order of candidates in which the seats they win are filled. In practice, both systems have their advantages and disadvantages — it could be argued that while an open list allows voters to pick individual candidates (e.g. ones with their preferred political views or ones from their local area) giving very local and personal accountability, many voters may simply just care about the party they pick, not any specific candidate from a long list. For this analysis however, whether an open-list, a closed-list, or a hybrid, is chosen makes no difference — it merely uses overall party votes from the actual election and recalculates them under the new PR system. In my ideal scenario, I'd imagine it being either an open-list or a hybrid where candidate order is fixed but it is disclosed on the ballot and candidates being fielded must be from the constituency for at least some level of local representation.

My main argument for this system is that it is a simple system that compromises between perfect proportional representation (which would mean simply tallying up the votes nationwide and allocating seats based on that) and the one advantage of the current FPTP system which is local representation. When drawing constituency boundaries for this system, I tried to follow county/regional lines as closely as possible so that the British electorate is always represented by someone from their area — perhaps not as immediate of an area as under FPTP but still from your area who (hopefully) understands the needs of the region.

Example:
Imagine yourself as a resident of the town of Chesterfield in Derbyshire. In the 2024 FPTP election, the local Labour candidate won with 46% of the vote, meaning if you're part of the remaining 54% (a majority!) of voters in your area, you have no local representation. In fact your county as a whole, which has 11 MPs, despite voting 40% for Labour, sent 11/11 Labour MPs to Parliament. 40% of the votes speak for 100% of the population. Now under the new system, you get to vote for which 11 MPs will represent Derbyshire as a whole. Using 2024 election data, Derbyshire now sends 5 Labour, 4 Conservative, and 2 Reform MPs (with Lib Dems and Greens not making the cut for one seat).

The exact methodology, rules, and critical analysis for this new system are detailed later, but as a summary, here is what the 2024 UK general election would look like under the new system. Note the differences between popular vote, seats under FPTP, and seats under multi-member PR.
2024 United Kingdom general election under D'Hondt

Methodology

1. Drawing electoral boundaries
Electoral boundaries should try to follow existing cultural/administrative boundaries that British people are familiar with (their county, for example) as best as possible. For the sake of it being the only available voting data, I combined existing FPTP constituencies to form the new ones. They generally tend to follow county boundaries (which is good) but there are a few inconsistencies that arose when electoral boundaries were redrawn for the 2024 election not always following county boundaries. So for the purposes of this map we have Tiverton being lumped into Somerset, Bordon into Surrey, Malmesbury into Gloucestershire, Wetherby into North Yorkshire, and a couple others.

2. Constituency size
One of my first observations upon working on this project is that the more seats a constituency has, the more closely allocated seats proportionally match popular vote (an explanation as to why is under the Critical analysis of results section), so larger constituencies are favourable for proportionality reasons. However, as explained earlier, a larger constituency may detract from the local/regional representation aspect so the compromise I decided on is to limit the minimum constituency size to 4 seats and the maximum to 20 seats (a 75-seat London constituency would be ridiculous, as would a 1-seat Shetland & Orkney constituency). This meant that some big counties had to be split apart and some small ones combined with others.
3. Allocation of seats
The D'Hondt method of apportionment, also known as the Jefferson method or the greatest divisors method, works by assigning a quotient to each party before each round of allocation, with the number of allocation rounds equal to the number of seats open. The quotient is given by:

V = number of votes received, and s = number of seats currently allocated (initially 0)

\[ quotient = \frac{V}{s + 1} \]

The quotients are initialised as the total vote tally.
In the first round, the first-ranked party gets allocated a seat and their quotient becomes half their vote count
In the second round, the party with the highest quotient gets allocated a seat. If this is the first-ranked party, their quotient becomes a third of their vote count. If it is the second-ranked party, their quotient becomes half of their vote count.
Repeat the process until all seats have been filled.

This loop in Python looks like:

        while total_seats < number_of_seats:
            max_party = max(sorted_votes, key=sorted_votes.get)
            seats[max_party] += 1
            total_seats += 1
            sorted_votes[max_party] = votes[max_party] / (seats[max_party] + 1)
        
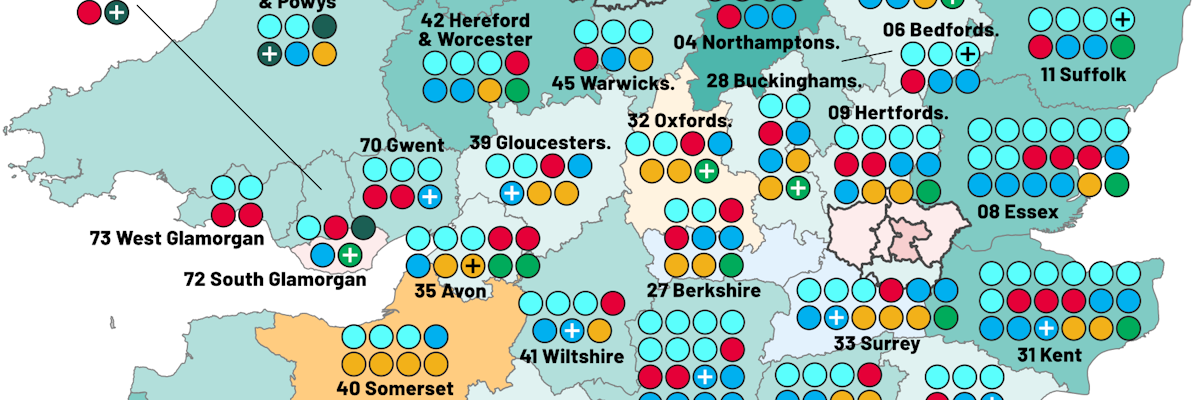
Below is an example for Warwickshire, a 6-seat constituency:
Allocation round 1 2 3 4 5 6 Seats % vote % seats
Labour Party 90 025 45 012 45 012 45 012 30 008 30 008 2 31.4% 33.3%
Conservative Party 86 657 86 657 43 329 43 329 43 329 43 329 2 30.2% 33.3%
Reform UK 47 812 47 812 47 812 23 906 23 906 23 906 1 16.7% 16.7%
Liberal Democrats 43 615 43 615 43 615 43 615 43 615 21 808 1 15.2% 16.7%
Green Party 15 998 15 998 15 998 15 998 15 998 15 998 0 5.6% 0.0%

Critical analysis of results

The primary observation from these results is that the big parties are still slightly overrepresented, albeit nowhere near as much as under FPTP. Because the the first-ranked party receives a seat in the first round of apportionment, this gives that party an advantage in seat allocation. This is visible not only in Labour being overrepresented in Parliament by 7.5%, but also in Scotland where SNP is either the first or second-ranked party by popular vote, giving them a slight overrepresentation (3.1% of seats to 2.5% of votes). This is most prominent in constituencies with fewer seats, as there is a lack of granularity. For example, in a small 5-seat constituency each seat represents 20% of the total, meaning rounding up or down to the nearest 20% produces some misrepresentation error, and a smaller party likely needs about 20% of the vote to qualify for one seat (this is a very rough estimate as it depends on the distribution of votes for the other parties) In contrast, in a 16-seat constituency, each seat is worth only 6.25% of the total, meaning a party that gets around 5-10% of the vote will get one seat (which wouldn't happen in the 5-seat constituency). However, this slight misrepresentation is the trade-off for retaining local representation and not just running one big nationwide election, and I believe my system strikes a good balance between maintining proportionality and keeping a local MP.

A second observation I noticed is that the degree to which the first-ranked party leads by coupled with how fragmented the remaining parties are, also plays a factor. Receiving more than double or triple the number of votes than the next best party produces overrepresentation due to how seat allocation works. This is prominent in a seat like West Glamorgan where Labour received 44% of the vote but got 3/4 seats, or 75%. This is because the rest of the votes were fragmented amongst the other parties: second-placed Reform got 20% and third-placed Conservatives got 12%. In contrast, in Falkirk & West Lothian (another 4-seat constituency), Labour also received 44% of the vote but only got 2 seats, or 50%, as the remaining votes were mostly concentrated for SNP. There's a definite shadow of tactical voting and the spoiler effect lingering here, but I'd argue that their effect is still nowhere near as strong as it is under FPTP. This is the main reason why I decided on a minimum cut-off for the constituency size at 4 seats, as any smaller and tactical voting becomes more prominent, yet there are some regions where a small constituency is required as it can't neatly be combined with others. Of course, the solution to eliminating this is raise the minimum cut-off, but this will once again affect the balance between proportionality and local representation.

What about independents?

It is worth pointing out that, in the map of results above, no independent candidates won seats in the election. That is not a flaw of the system, but rather a direct result of translating existing FPTP election data into multi-member PR. Since an independent candidate may only run for MP in one constituency, their vote count is limited, thus under multi-member PR they have virtually no chance of having enough votes county/region-wide to qualify for even one seat. In practice under my proposed system, independent candidates would of course run to represent the county/regional constituency as a whole (e.g. Jeremy Corbyn — an independent in 2024 — would have run for all of Inner London East rather than Islington North) and take part in the same allocation process as the other parties. Note that in the case a very popular independent candidate were to receive enough votes to allocate them two or more seats, they remain capped at one seat and those subsequent seats go to the next largest party in that allocation round.

Example for a 7-seat constituency:
Allocation round 1 2 3 4 5 6 7 Seats % vote % seats
Party A 220 000 110 000 110 000 110 000 73 333 73 333 55 000 3 39.7% 42.9%
Party B 150 000 150 000 75 000 75 000 75 000 50 000 50 000 2 27.1% 28.9%
Party C 56 000 56 000 56 000 56 000 56 000 56 000 56 000 1 10.1% 14.3%
Independent 128 000 128 000 128 000 64 000 64 000 64 000 64 000 1 23.1% 14.3%

Here we see that the popular independent candidate should have gotten a second seat in round 7 based on number of votes, but since an independent cannot take more than one seat, it goes to the next largest party in that round (Party C).

Conclusion: what this could mean for British voting practices

Since there is no longer one, oftentimes predictable, winner in each constituency, I believe this system allows for a wider range of political positions to run and have a reasonable chance of winning a seat, particularly in larger constituencies. As no party ever wins a majority of the popular vote, every election will be a hung election meaning ruling coalitions would have to form like they consistently do in many European countries. It means that no party every sweeps an election, and representation becomes more aligned with how the British electorate actually votes.

Beyond this, supporters of platforms that have no realistic chance of winning in their current constituency would be less disillusioned or forced to vote tactically to game the system. Smaller parties, be they established or new, can now gather consistent support and put up a fight for seats, giving a more diverse range of representation that also works on the local and regional level.
Britain deserves an electoral system that is in line with reality and represents its diverse needs and opinions.

© 2025 Dawid Nawrocki